A Potentially Calming Aid
If concerns about the current dangers of Covid-19 to you or your loved ones are affecting your studies,
perhaps the data here may, in some cases, be helpful.
The data is presented only in support of the policy that more, appropriately-processed, information is better.
It is not intended to suggest that any state is healthier or better-managed than any other.
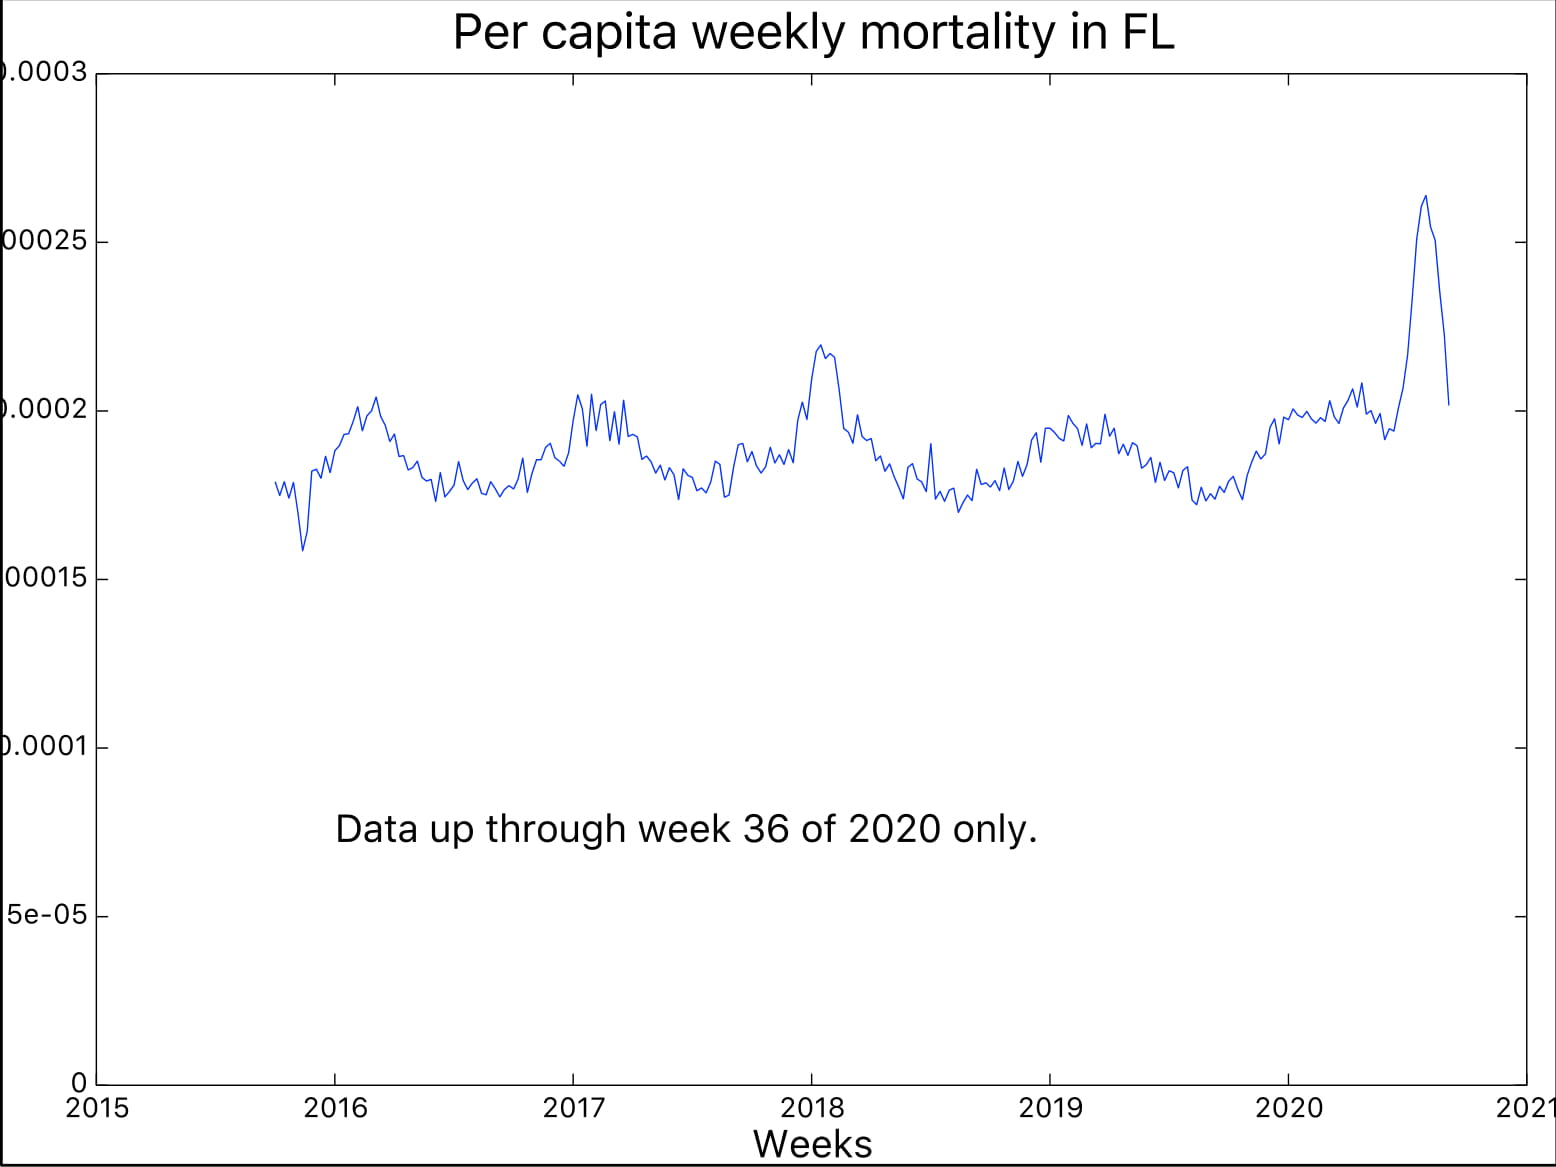
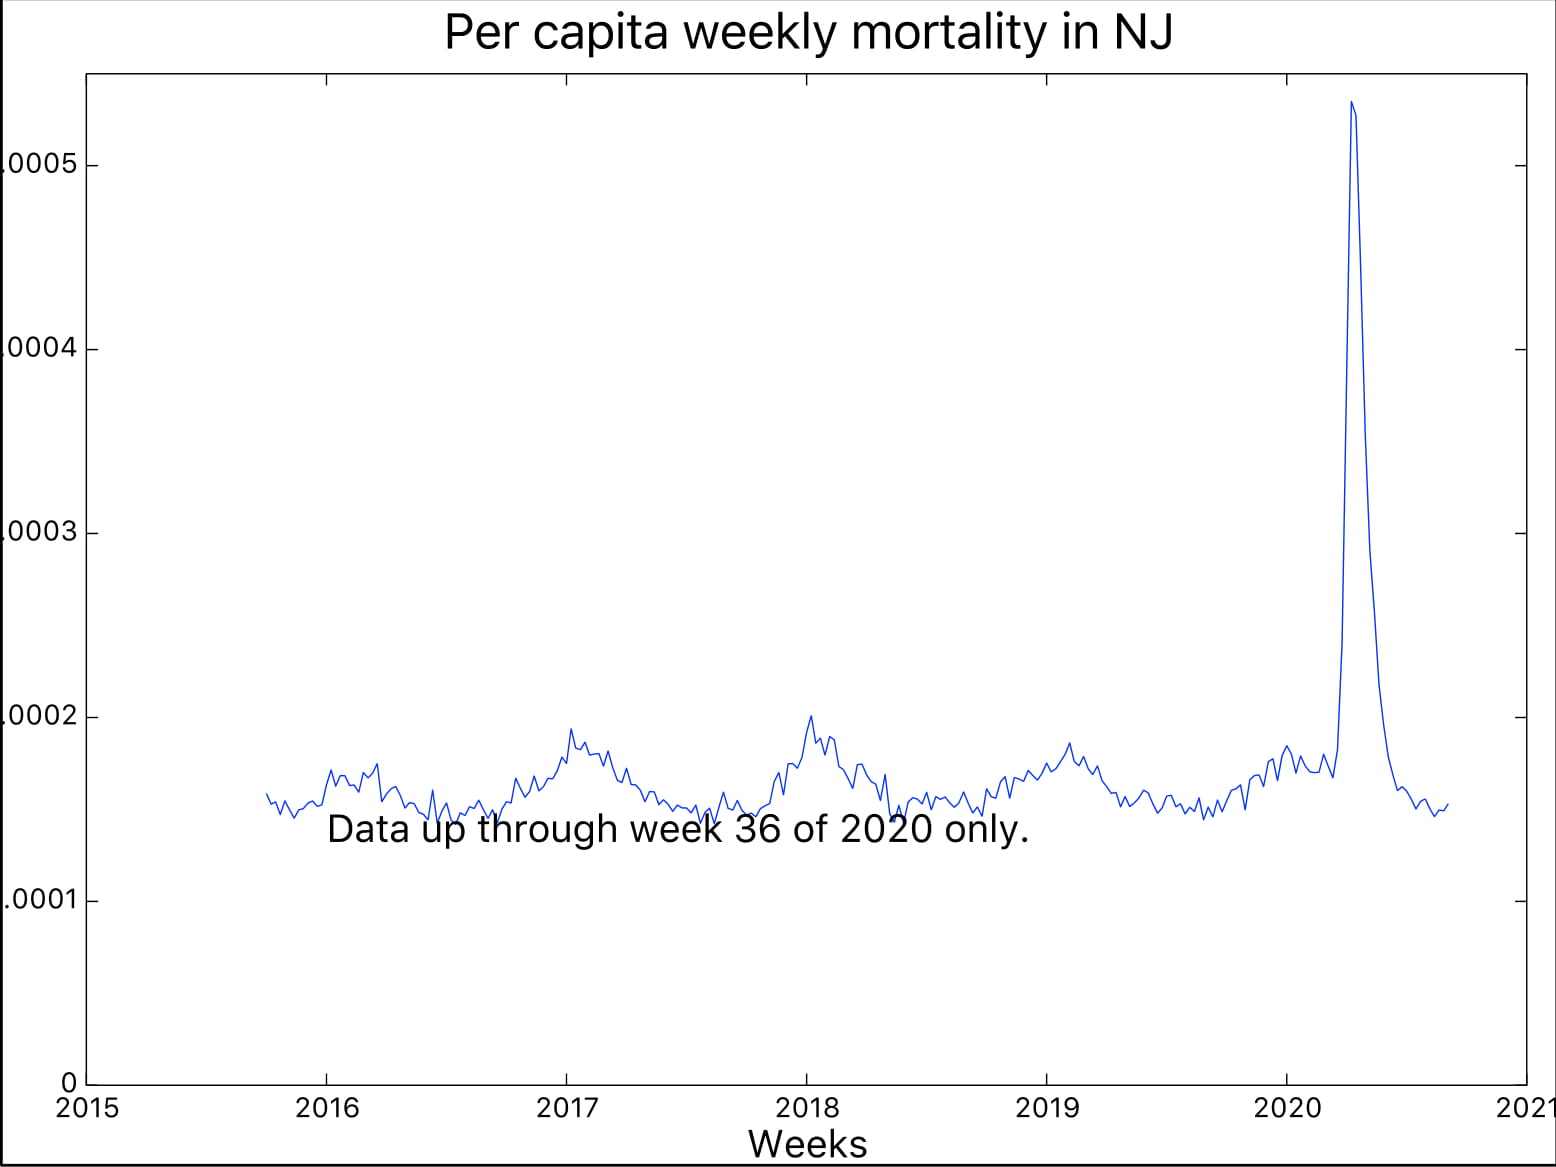
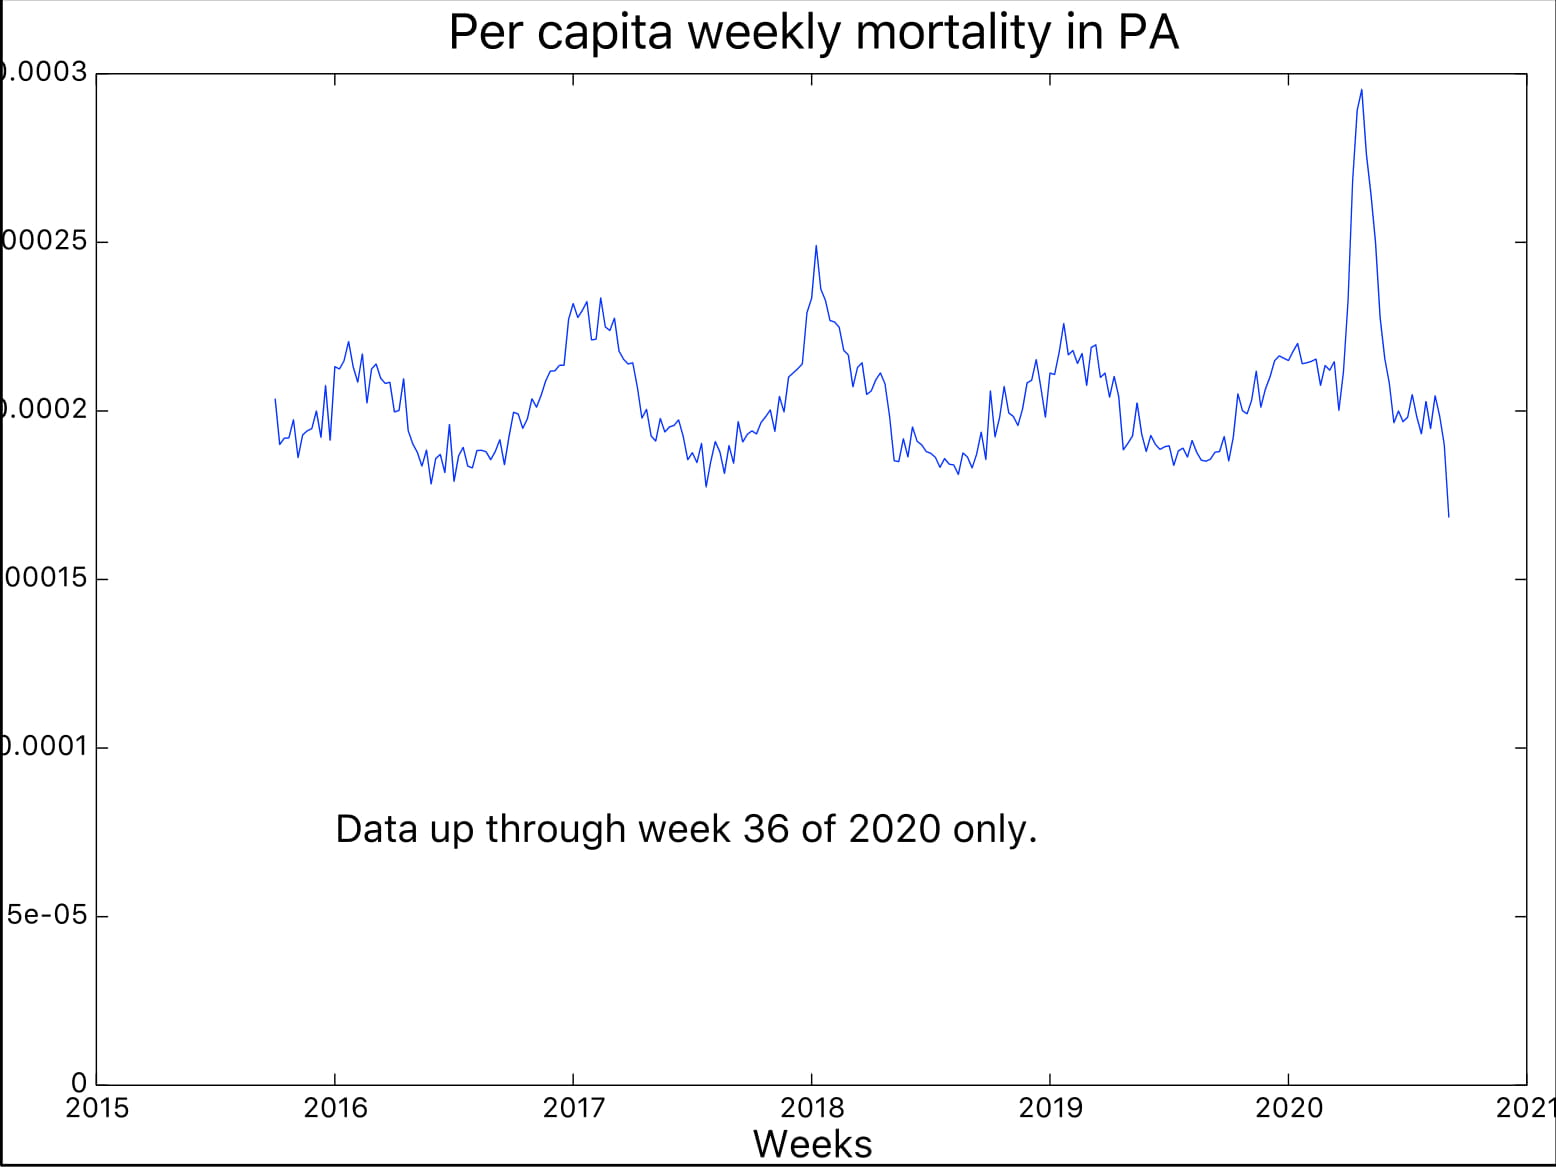
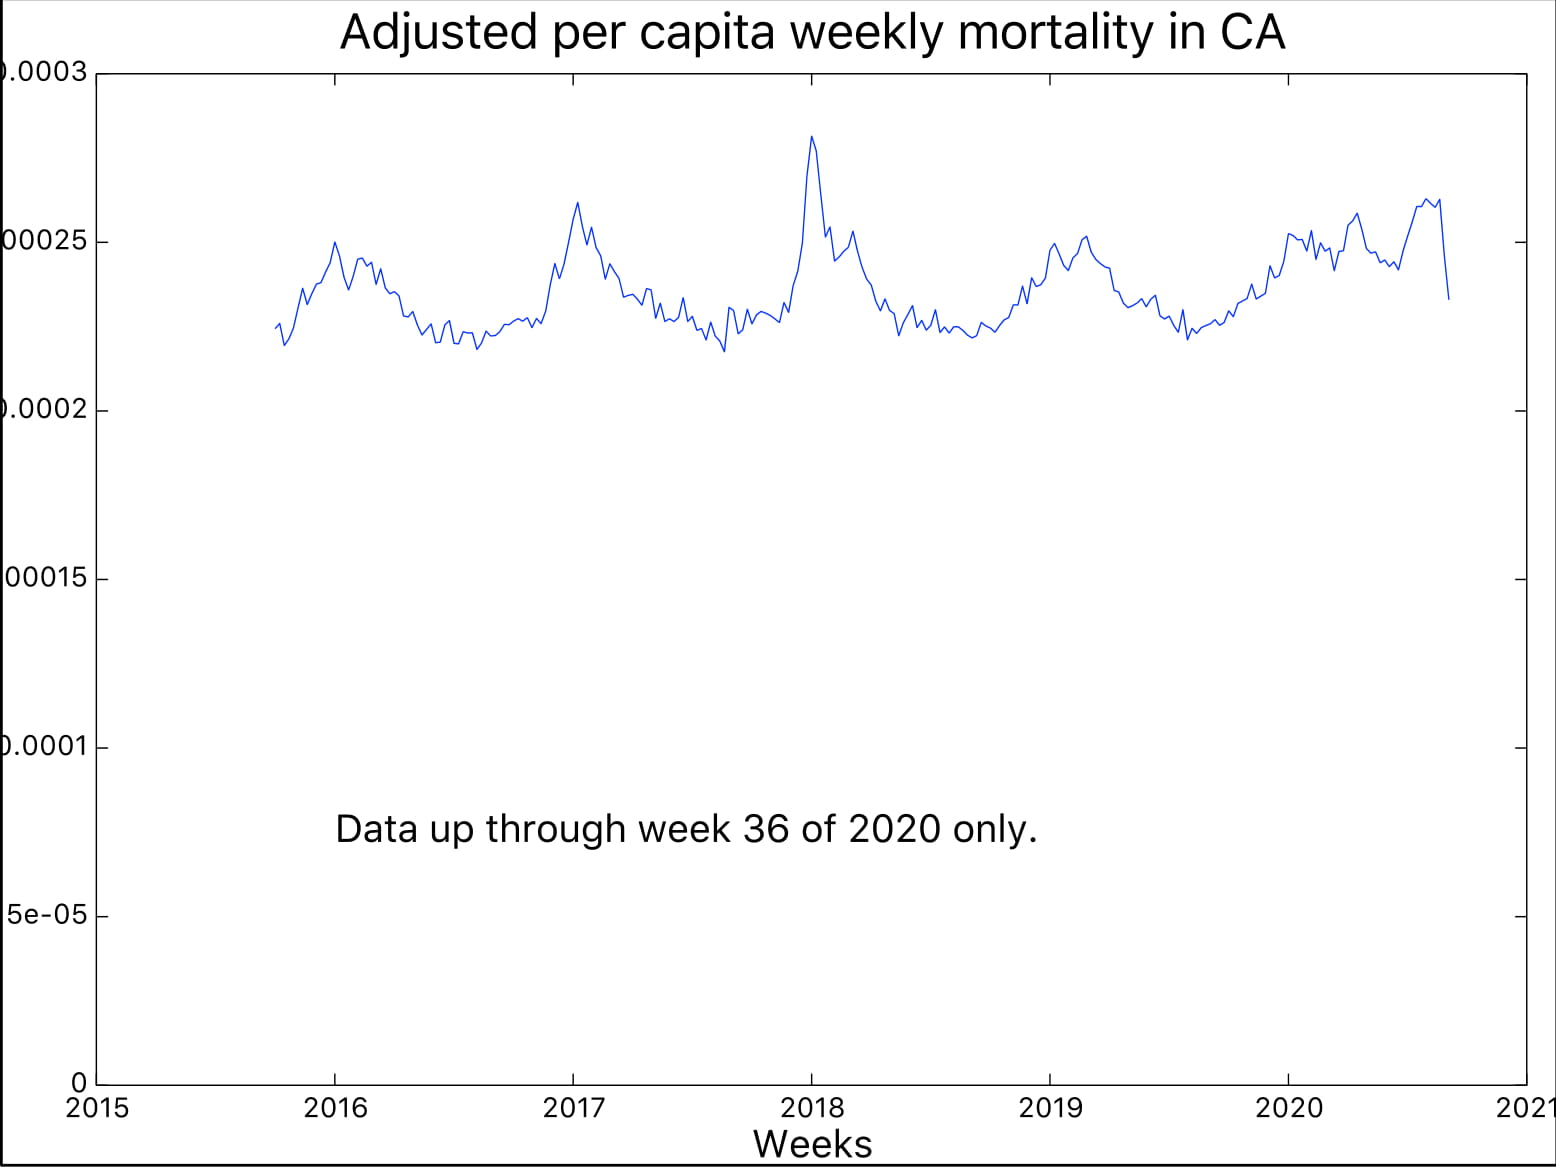
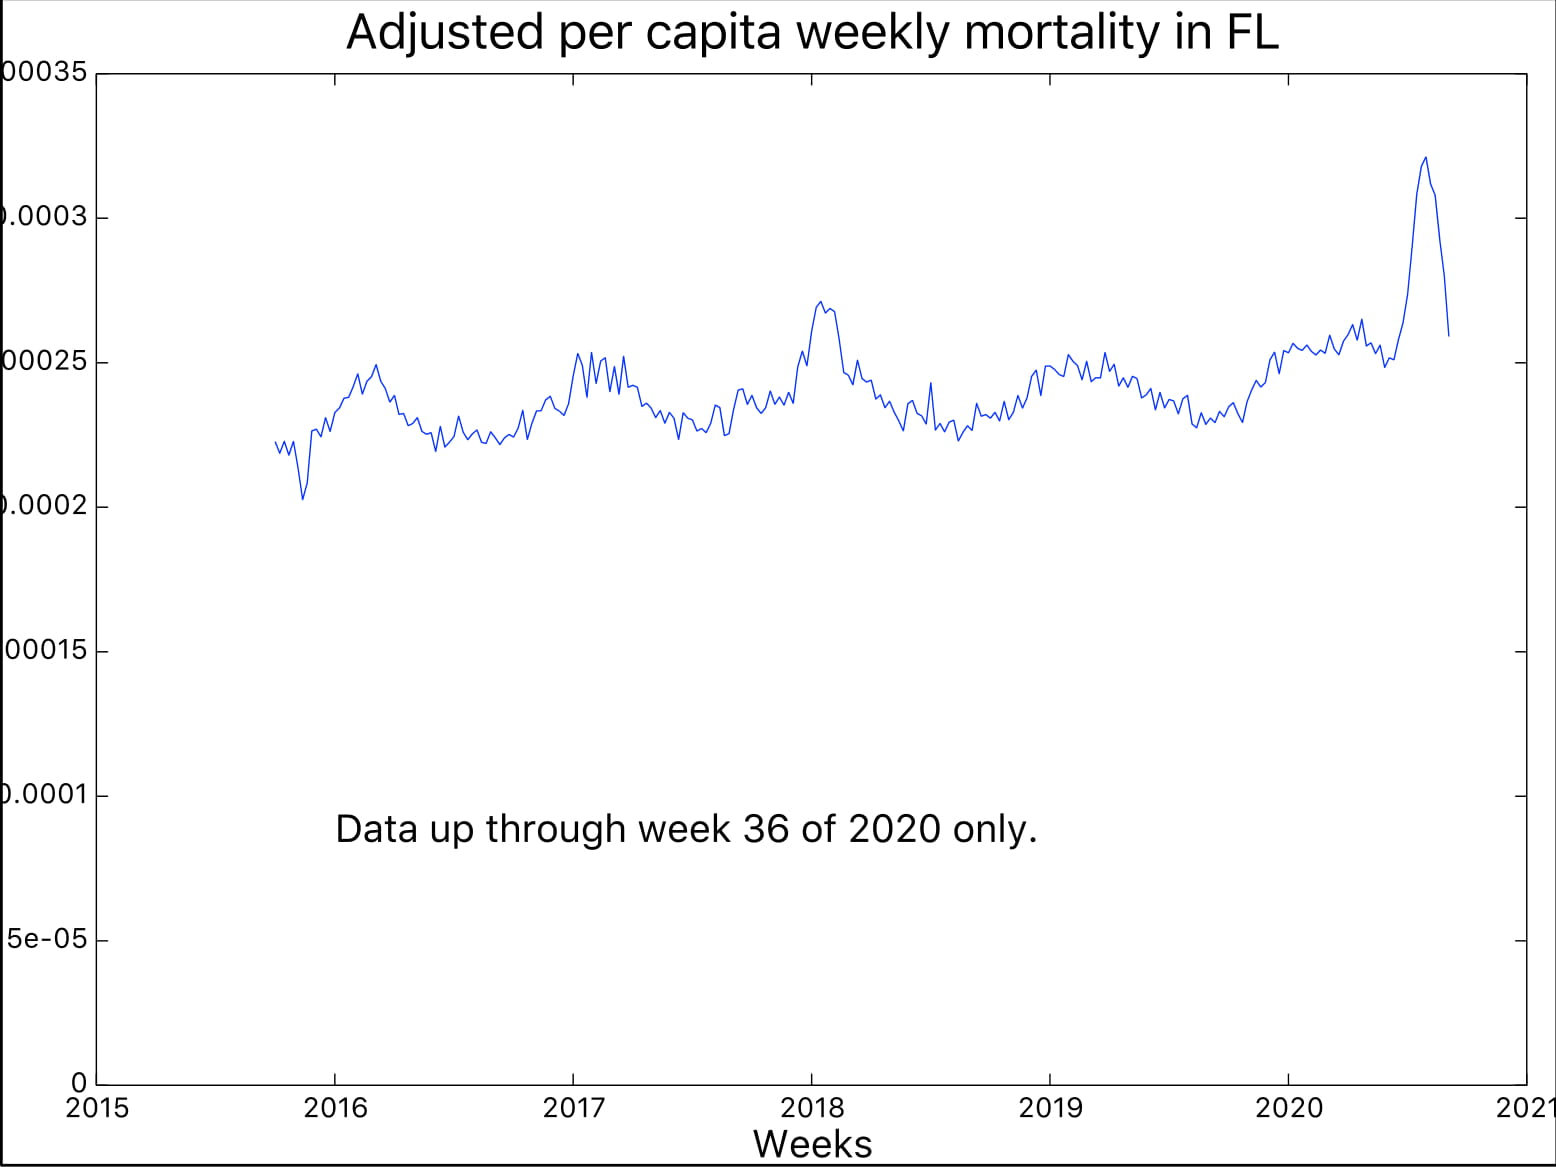
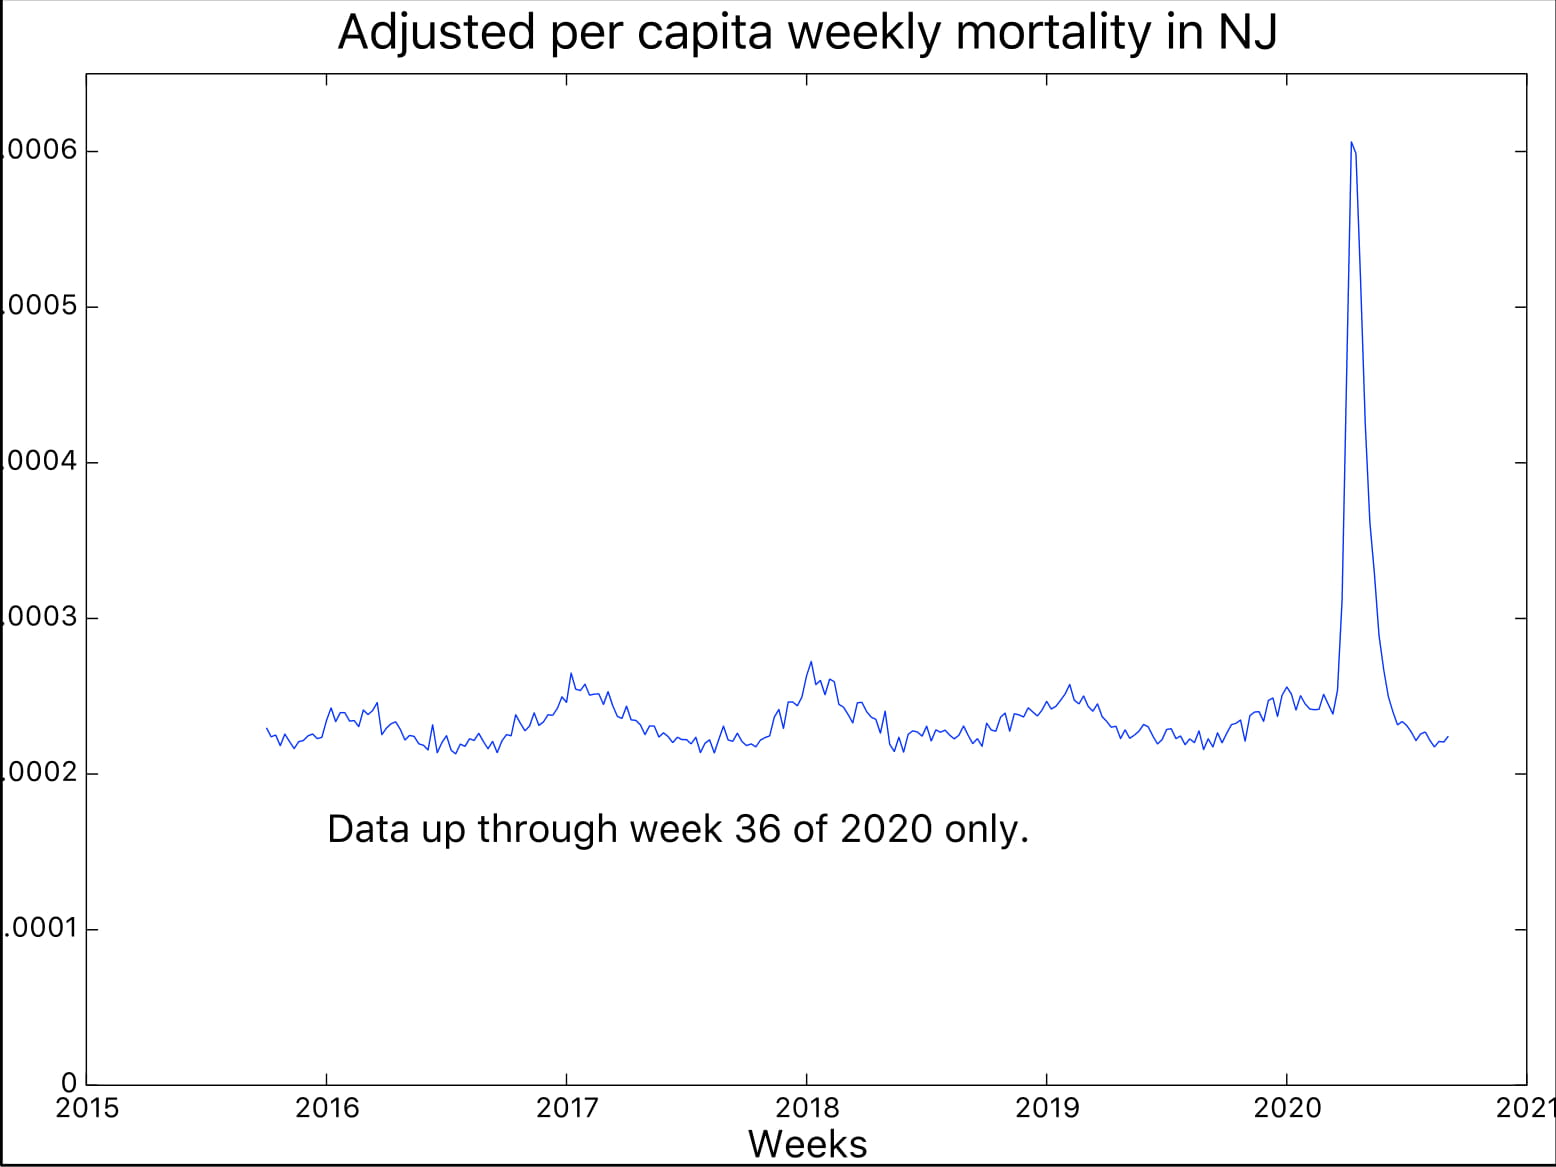
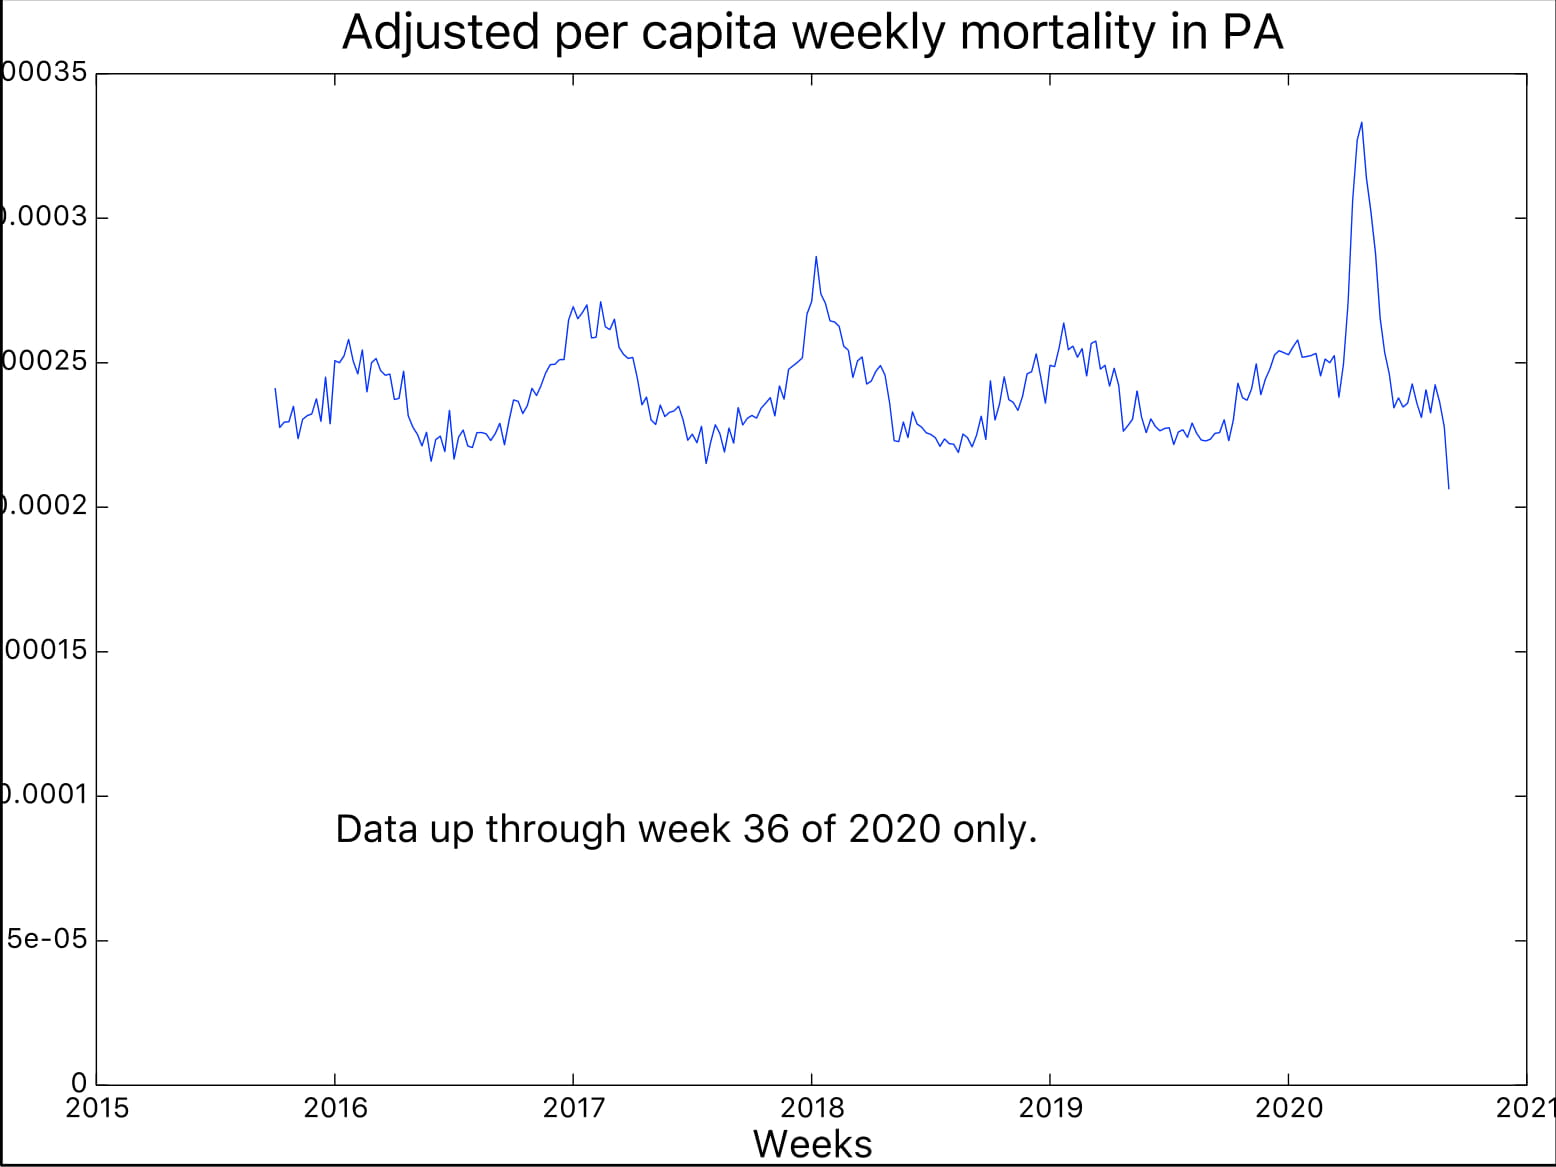
Below are the weekly total mortality rates in California, and for comparison,
Florida, New Jersey and Pennsylvania, from CDC data. More specifically, the data is obtained from a
CDC website
that indicates the total number of deaths per week.
The overall population data is from the
macrotrends website, with specific pages such as
macrotrends california data.
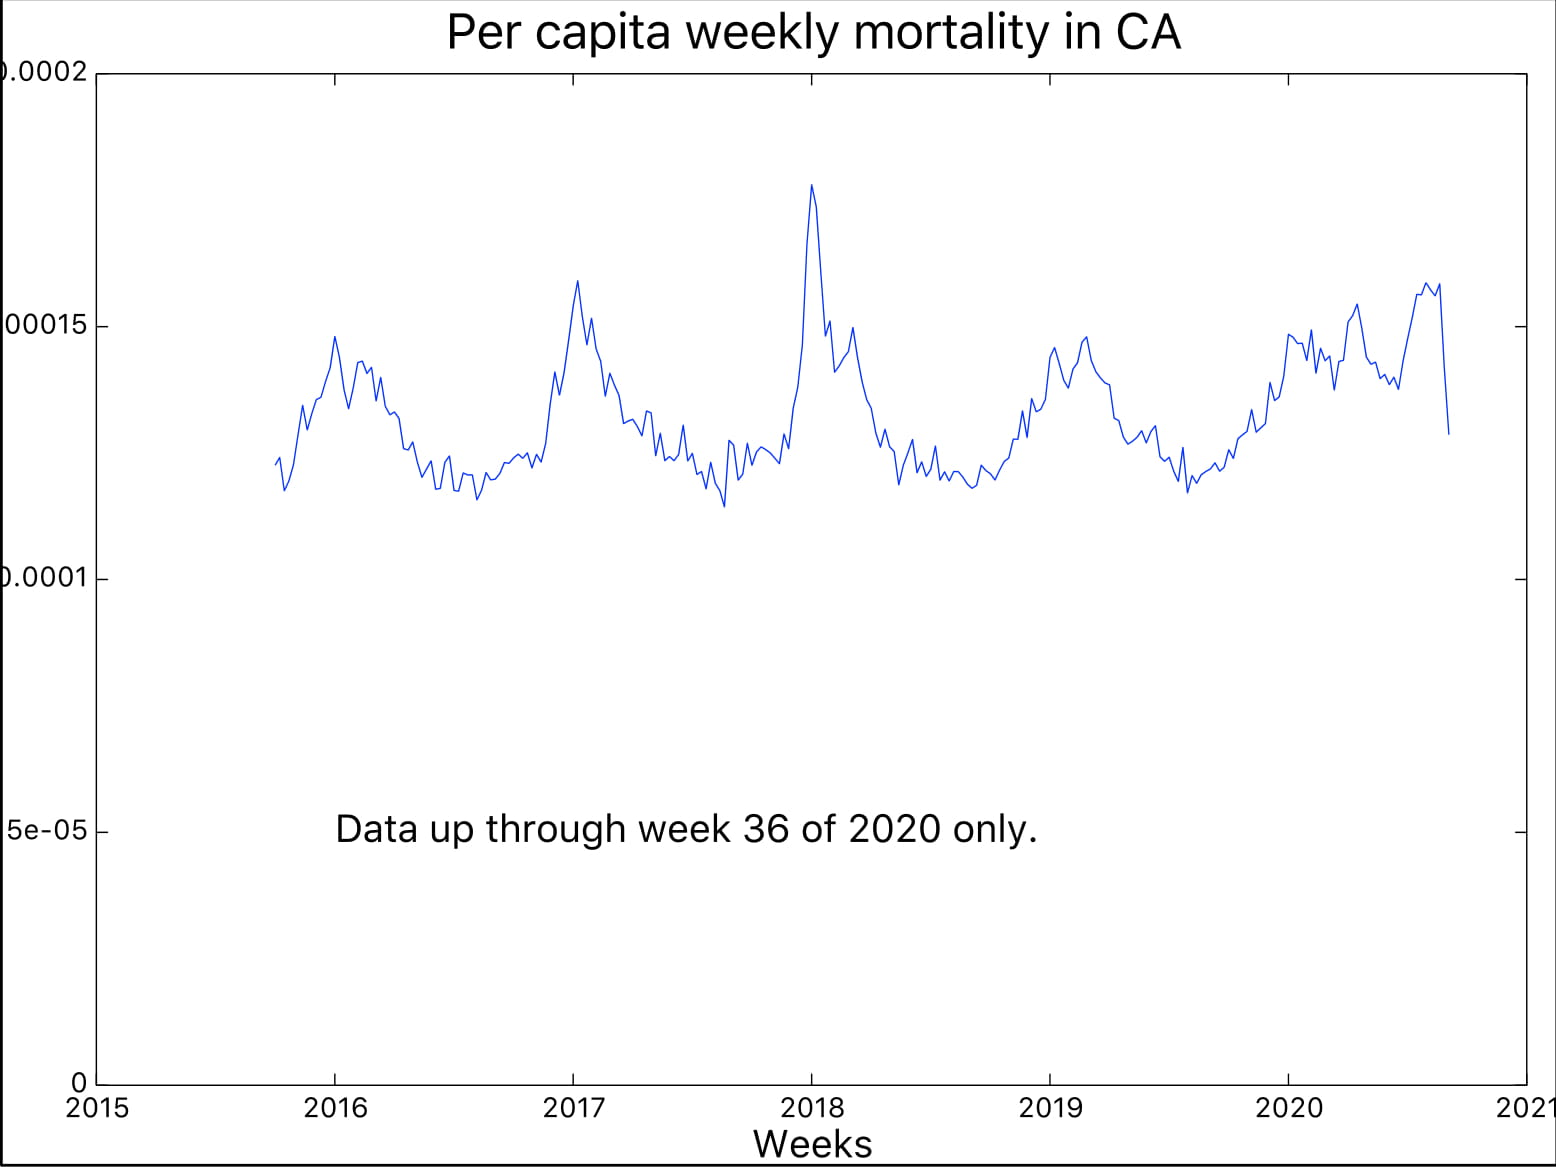
Although the CDC site indicates that the data there represents the total
number of deaths per week, a quick calculation indicates that the numbers the CDC is reporting
are sometimes simply too low given the population size and life expectancy.
Assuming that the missing deaths are relatively constant over time,
rather than proportional to the (constant plus periodic) reported deaths,
one obtains the vertically shifted mortality rates presented below.
(Note that if one instead assumes
that the missing deaths are proportional to the CDC-claimed total deaths, then the
curves are changed only by a rescaling of the vertical axis.)
The life expectancy data is from this
wikipedia page.
Back to my homepage